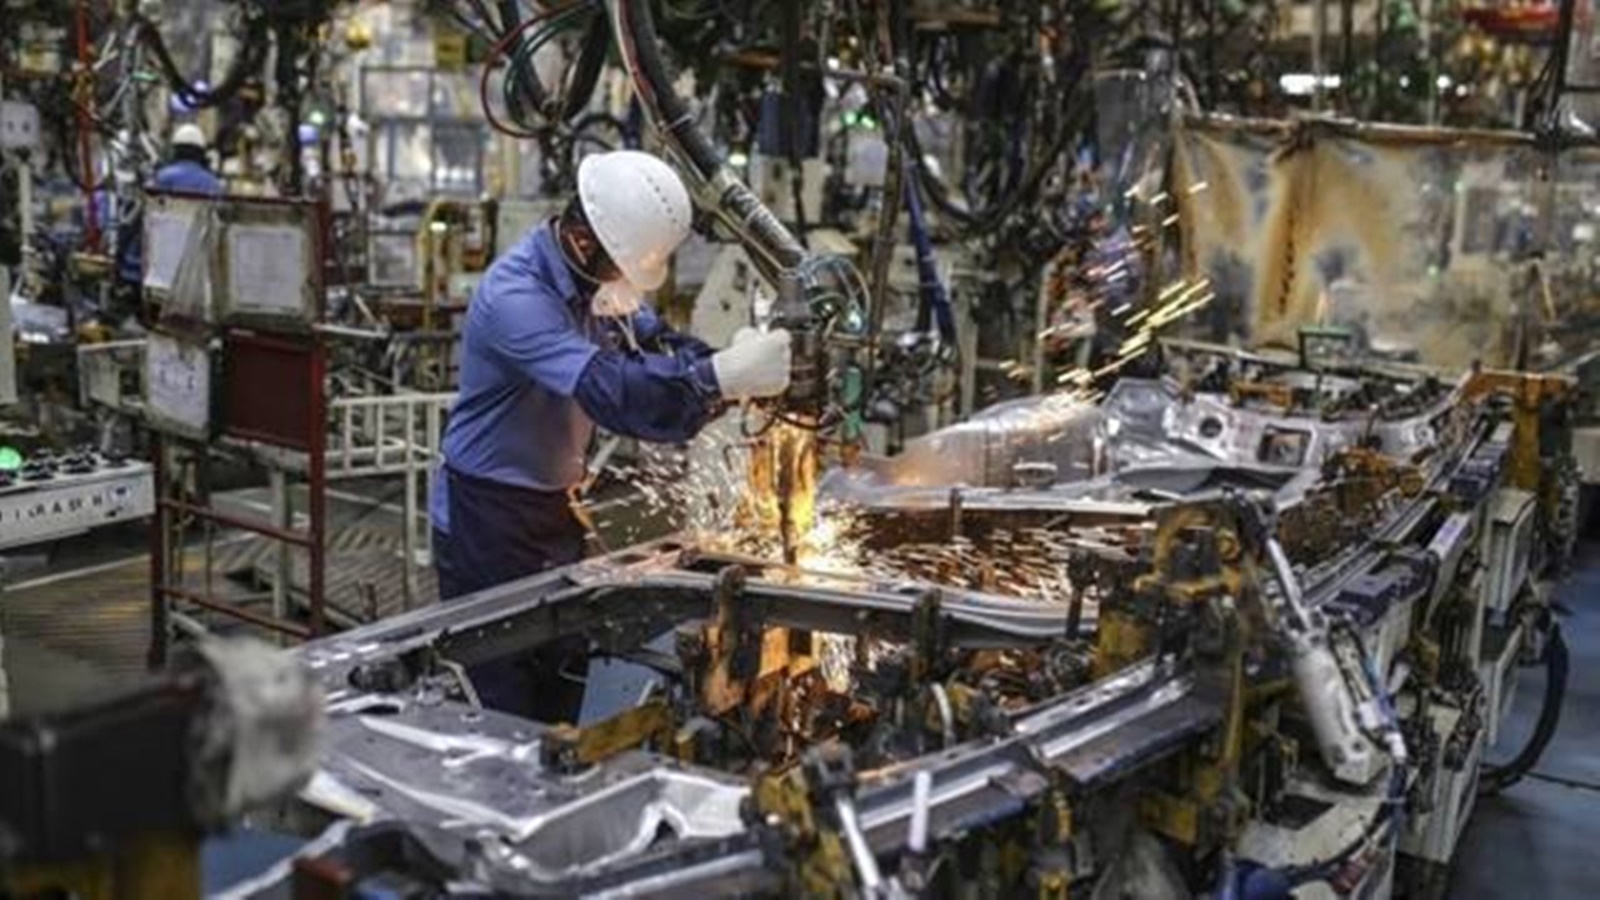
Economists are questioning the reliability of India's new manufacturing data, pointing to significant gaps between GVA and IIP growth rates. This analysis explores the potential cracks in the statistical framework.
- A massive divergence exists between Real GVA and IIP manufacturing growth.
- The manufacturing price deflator shows unexplained negative growth for nine quarters.
- The correlation between key industrial indicators has weakened significantly since 2012.
As the global manufacturing landscape shifts due to the 'China Squeeze,' India has positioned itself through flagship programs like Make in India and the Production-Linked Incentive (PLI) scheme. However, the ability to assess the success of these interventions depends entirely on the integrity of the underlying economic data.
Recent analysis of the new GDP series released by the Ministry of Statistics and Planning Implementation (MoSPI) has surfaced deep-seated concerns. While MoSPI has implemented new methodologies to address previous errors, the numbers themselves present several statistical anomalies that demand scrutiny.
Why This Matters
BozokMedia analysis shows that reliable data is the compass for national policy. If the manufacturing sector's performance is being misreported—either through overestimation or underestimation—it could lead to misaligned fiscal incentives and misguided global trade strategies against Chinese competition.
Reliable data is not just a statistical necessity; it is a strategic requirement for India to stand up to global economic pressures.
The Three Statistical Anomalies
The first major concern involves the manufacturing price deflator. New data shows negative growth for nine consecutive quarters between 2023 and 2025. This is highly unusual because the core Consumer Price Index (CPI) showed no signs of deflation during this period, suggesting a disconnect between price levels and value-added calculations.
Secondly, there is a startling divergence between Real Gross Value-Added (GVA) and the Index of Industrial Production (IIP). In the 2025-26 period, the real GVA growth rate was nearly double that of the IIP (11% vs 6%). While differences in definitions exist, the scale of this gap remains mathematically difficult to justify through informal sector growth alone.
Thirdly, the historical correlation between GVA and IIP has collapsed. Prior to the 2011-12 methodology changes, these two metrics moved in tandem. Today, they exhibit erratic and divergent patterns, making it difficult for analysts to form a cohesive picture of industrial health.
| Metric | Estimated Growth (22-26) | Scope |
|---|---|---|
| Real GVA | ~11% | Includes Informal Sector |
| IIP | ~6% | Output Volume Focus |
Frequently Asked Questions
1. Why does GVA grow faster than IIP?
Ideally, GVA can only grow significantly faster than output volume if there is a massive leap in productivity and efficiency.
2. What is the 'China Squeeze'?
It refers to the aggressive expansion of Chinese manufacturing exports that threatens lower-skill industries in developing nations.